
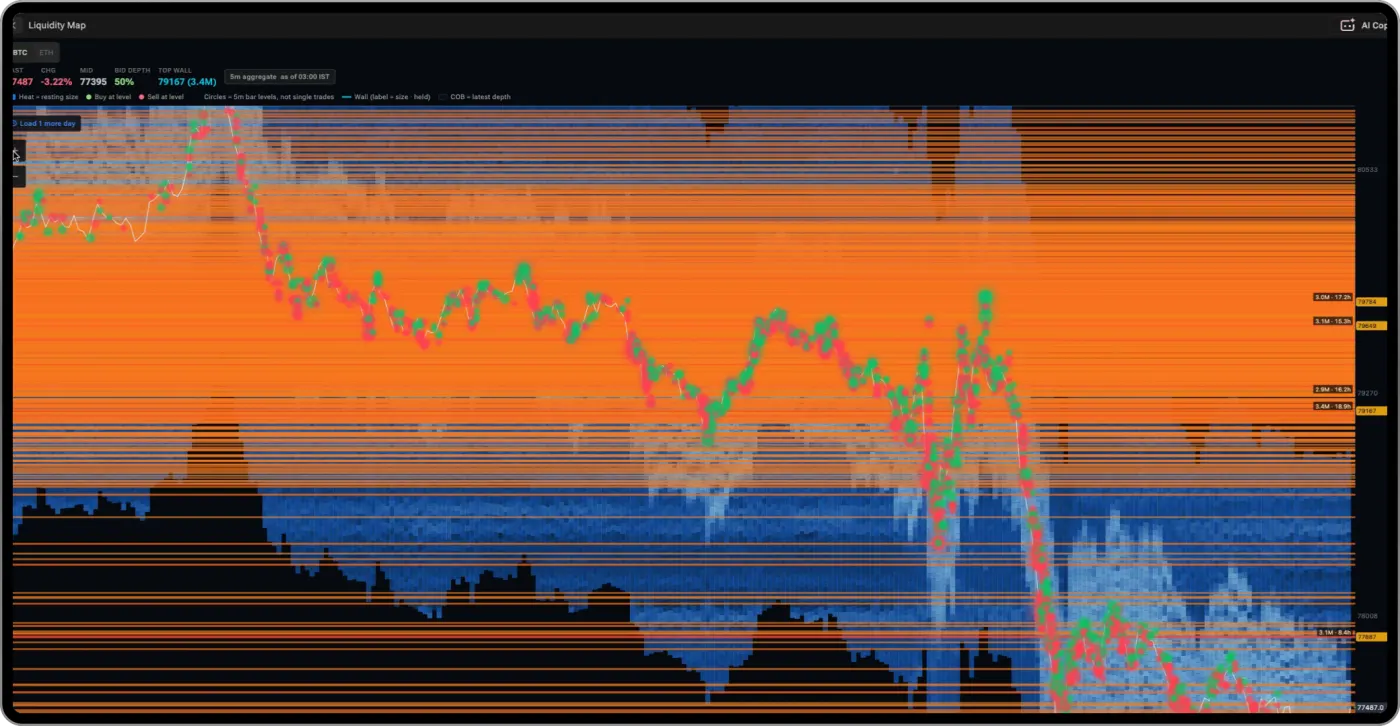
01Liquidity Map
The orders waiting to be filled, drawn as heat behind the price. Bright bands show how big a stack is and how long it has sat there; circles are trades that went through.
Order-flow desks
Footprint, liquidity, depth, delta, funding and dealer positioning, each on a desk of its own, with a multi-year archive behind every screen.
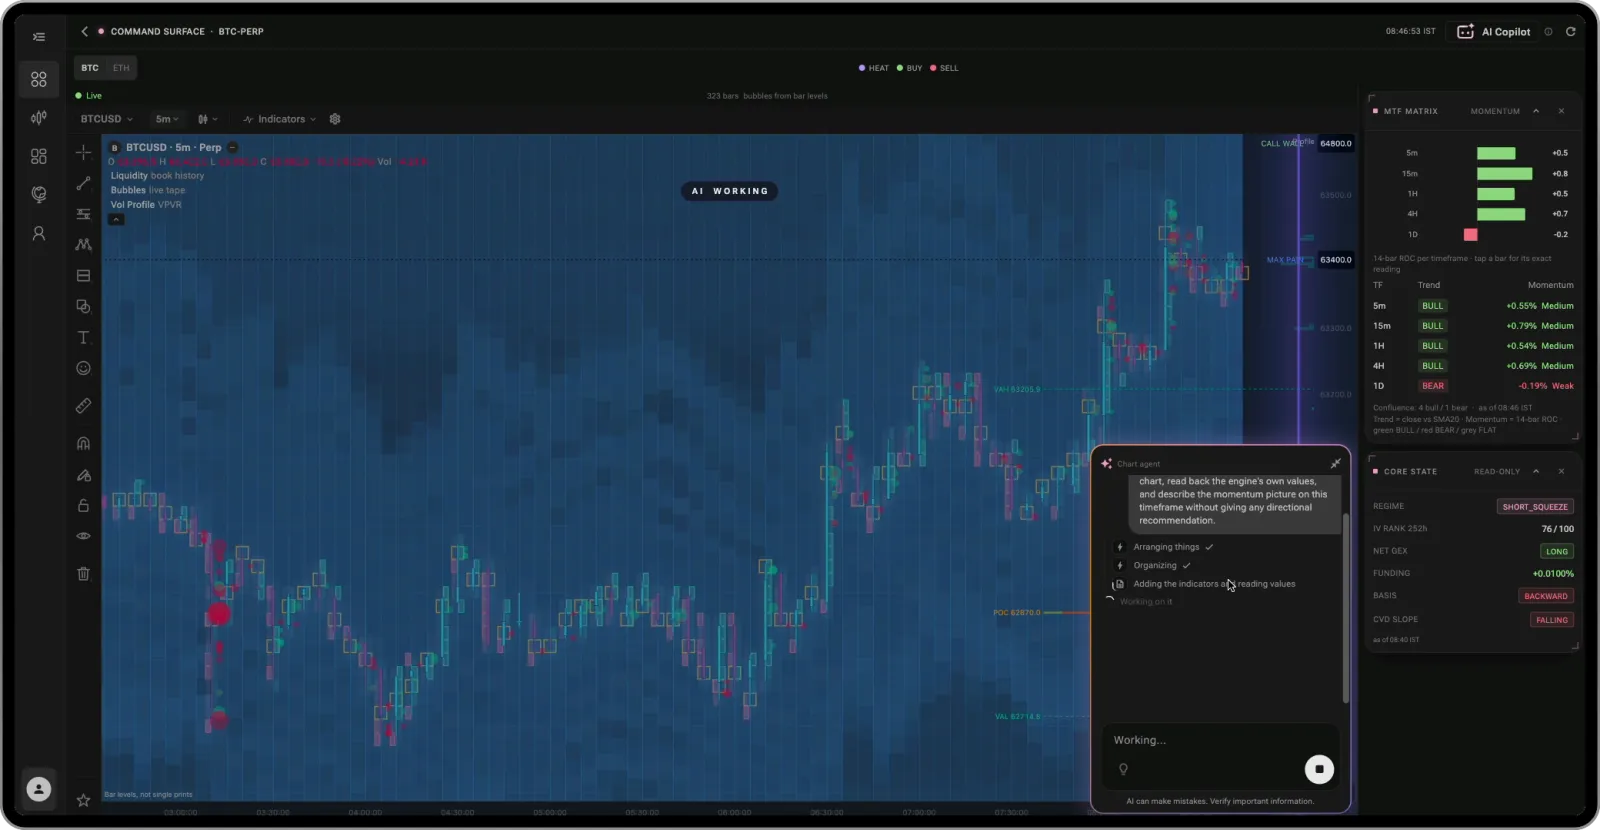
Command Surface
Hover or tap a dot.
The big four
01Liquidity Map
The orders waiting to be filled, drawn as heat behind the price. Bright bands show how big a stack is and how long it has sat there; circles are trades that went through.
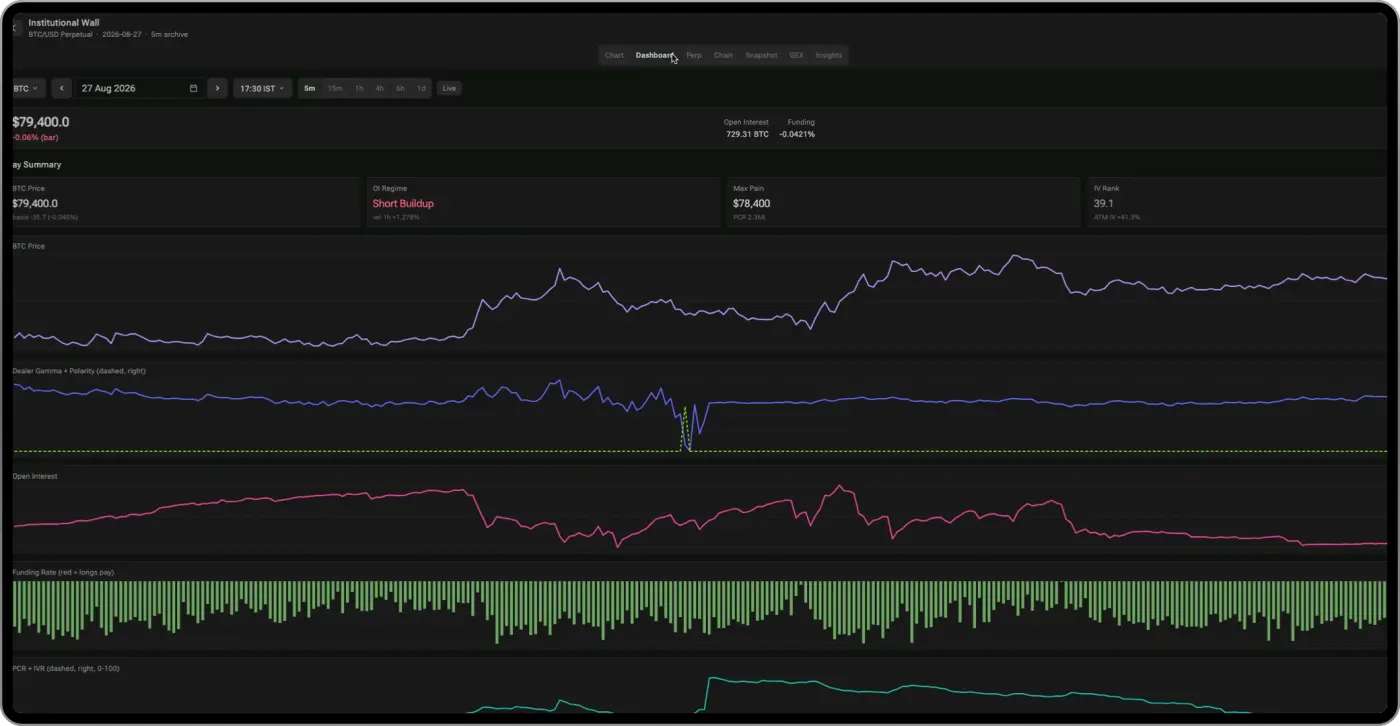
02Institutional Wall
Six tabs deep: walls and the gamma flip on the chart, max pain, funding and basis, calls against puts, every option leg priced at that bar, dealer gamma by strike. Pick any day and it rebuilds.
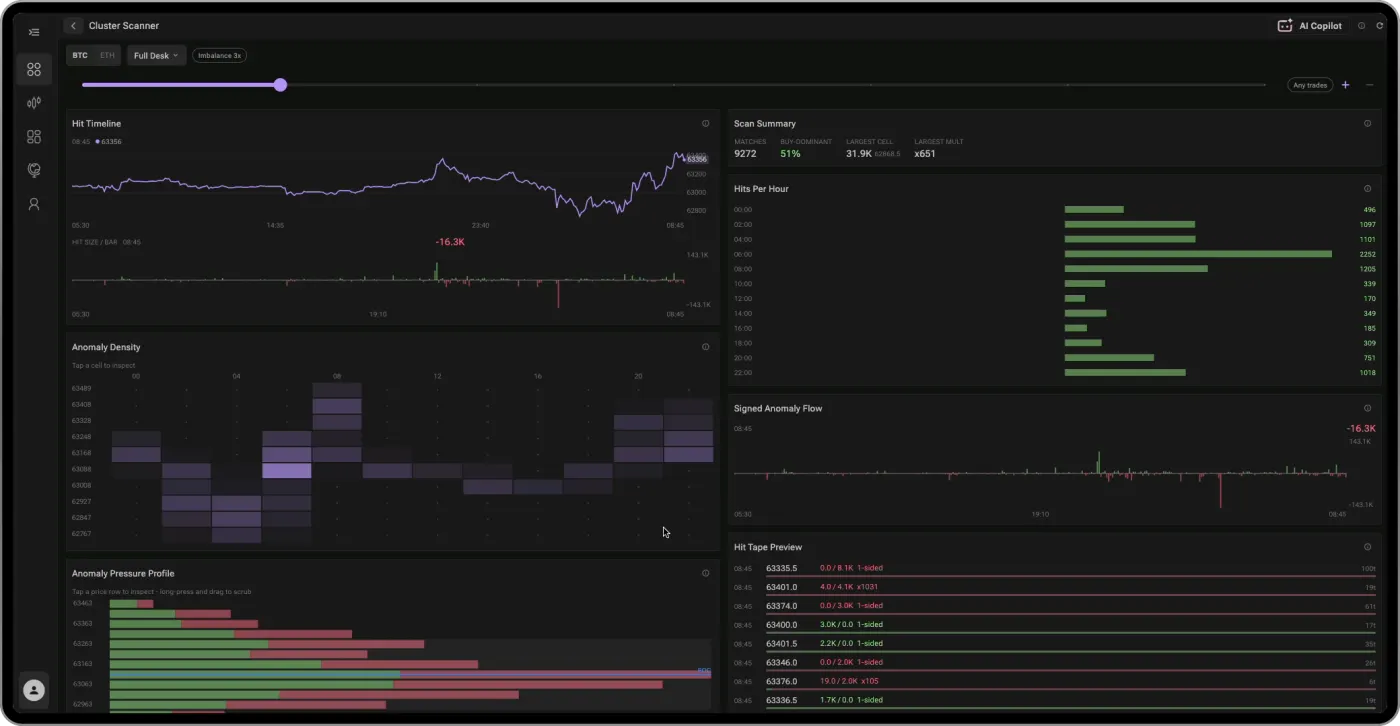
03Cluster Scanner
Every ladder scanned, only the imbalanced cells kept, where one side traded three times the other. The Copilot knows the rule and explains any match.
04Funding and Basis
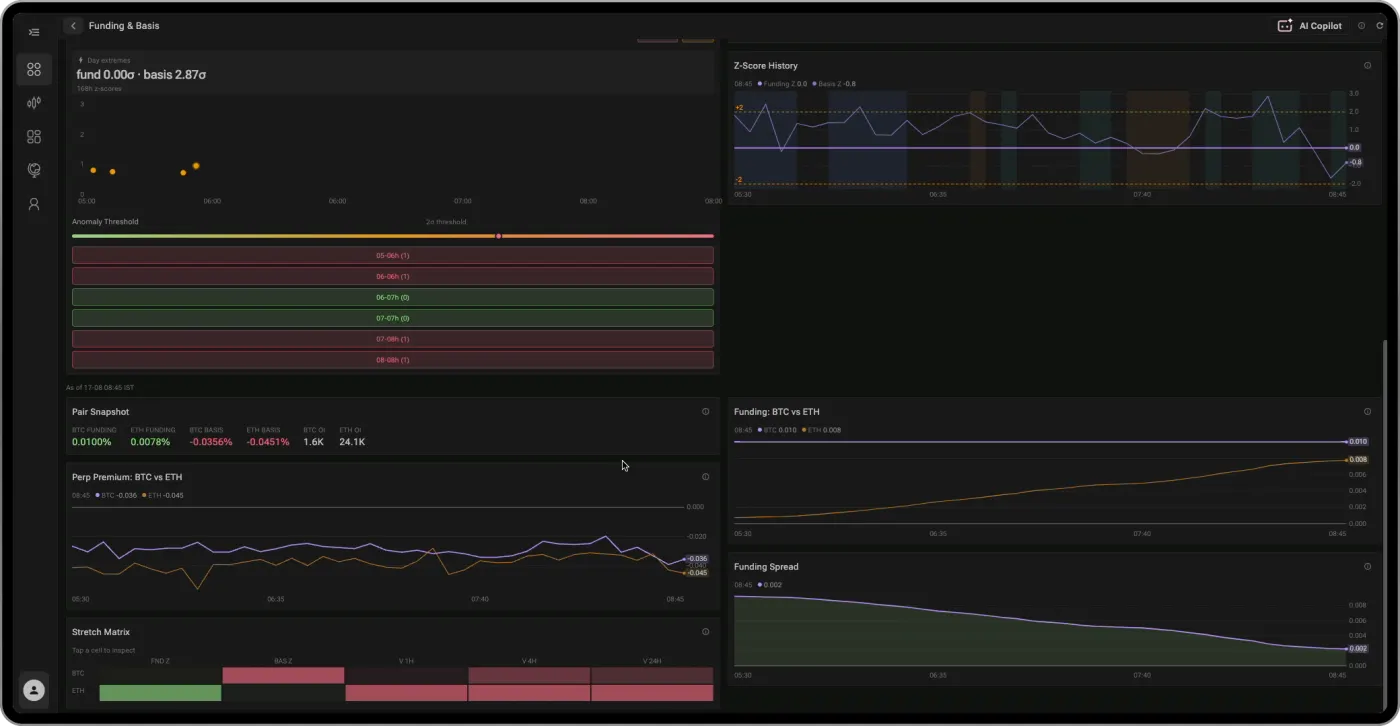
What it costs to stay in a position, and how far the perpetual trades above or below spot. Pick any past date and it rebuilds that day.
Order flow, depth and options
Click a window to bring it forward.
Point at a desk to see it on the phone.
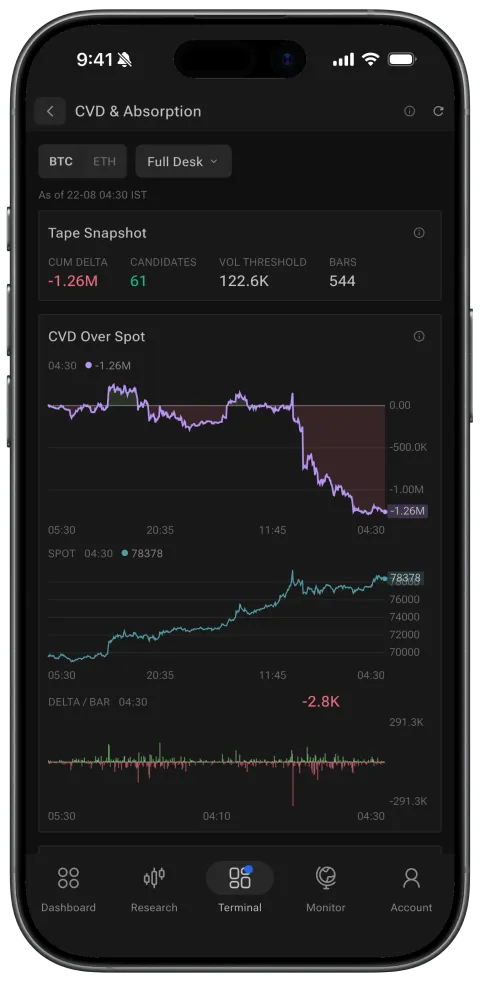
21 crypto order-flow desks and 12 equities desks: footprint, dealer gamma, funding, volatility surface and resting liquidity on real exchange planes. Data, not advice.
The Wall
Footprint, heatmap, VPVR and CVD under a live MTF matrix.
Liquidity Map
Resting-book heat behind price, with trade bubbles.
Order Footprint
Bid vs ask traded at every single price.
DOM Ladder
Vertical price ladder with a live tape rail.
Dealer Positioning
Max pain, net GEX, gamma flip, call & put walls.
GEX-by-Strike
A right-edge gamma profile, polarity shaded.
Funding & Basis
Carry, perp premium, z-scores and OI velocity.
Volatility Lab
IV rank, ATM surface across expiries, skew heatmap.
Greeks Desk
Option analytics computed from live broker quotes.
Strategy Lab
Multi-leg payoff analytics, priced live.
Risk Desk
Portfolio risk from holdings and cached history.
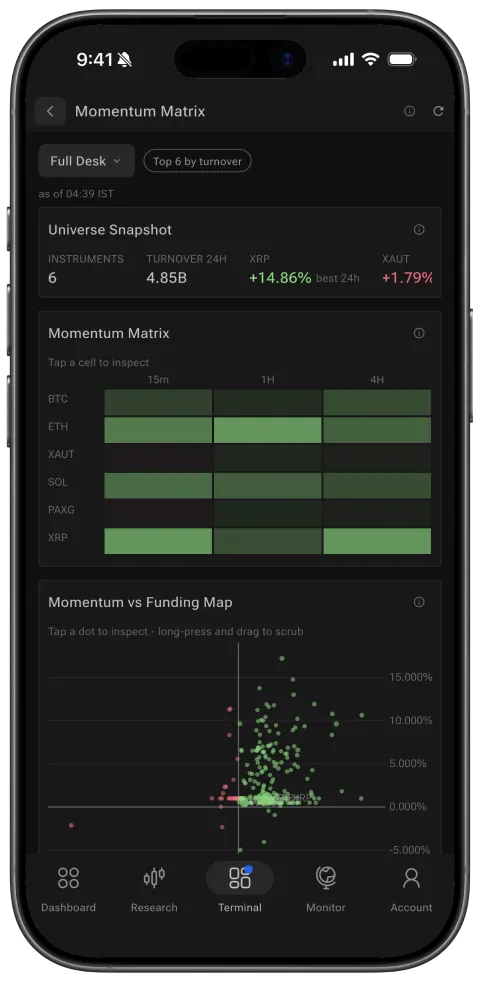
Momentum Matrix
Symbols down, timeframes across, heat per cell.
Risk Disclaimer
Trading in stocks, derivatives, and cryptocurrencies involves substantial risk of loss and is not suitable for all investors. Past performance is not indicative of future results. FlashTerminal is a technology platform and does not provide investment advice or recommendations. Please consult with a licensed financial advisor before making any investment decisions.