Commodities Dashboard

Where the physical world is tracked.

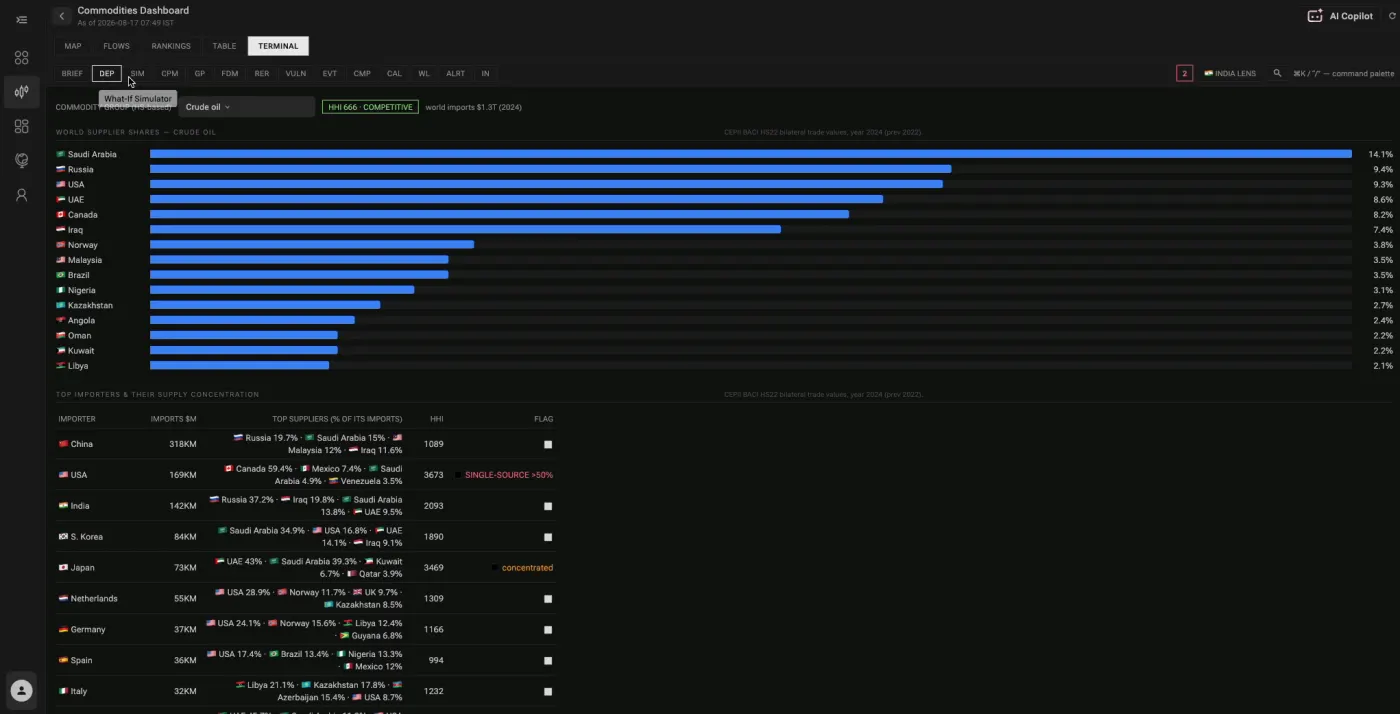
Trade routes, chokepoints, production and reserves for every country, across crude, gas, coal, iron ore, wheat, semiconductors, rare earths and more.

Five tabs. The whole world, sorted.

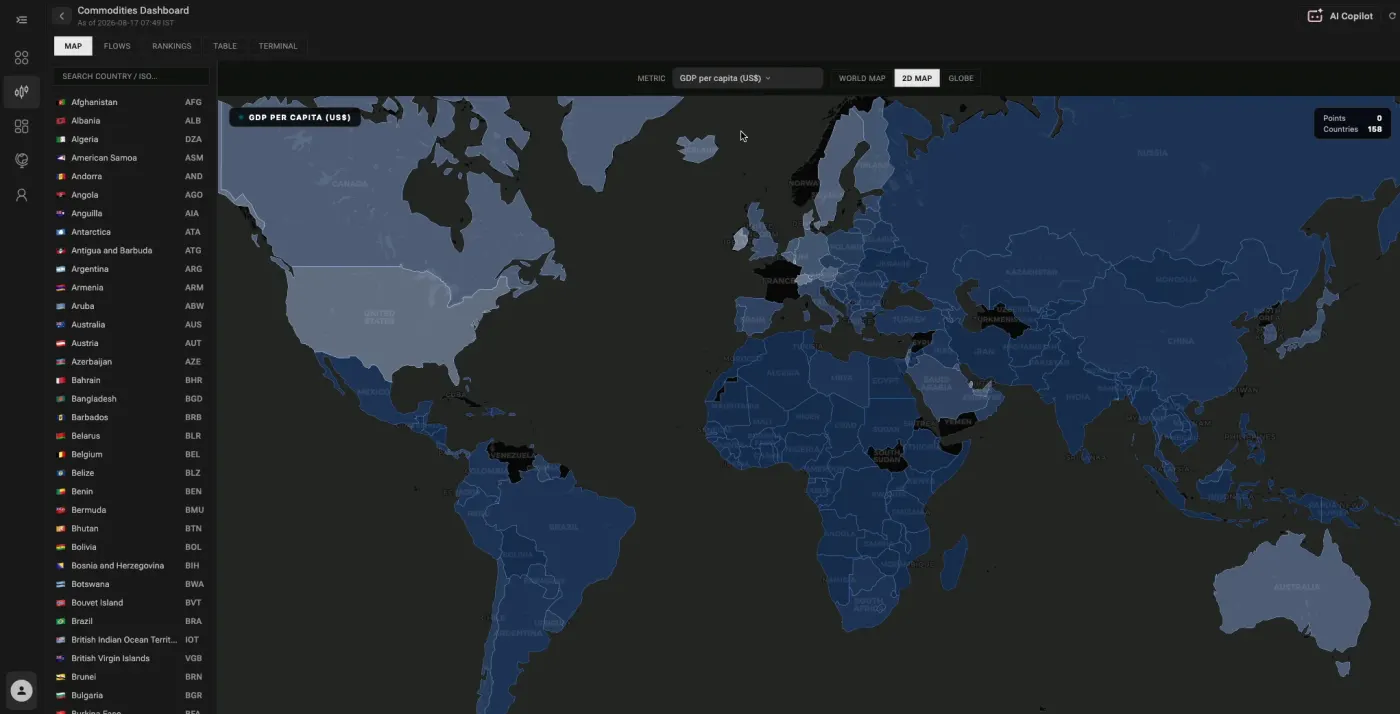
It shows what moves where, who depends on whom, and what happens if a route closes. Everything is drawn on Map & Globe, every country on one colour scale, whichever measure you choose.

01 Flows02 Rankings03 Table04 Map05 Globe
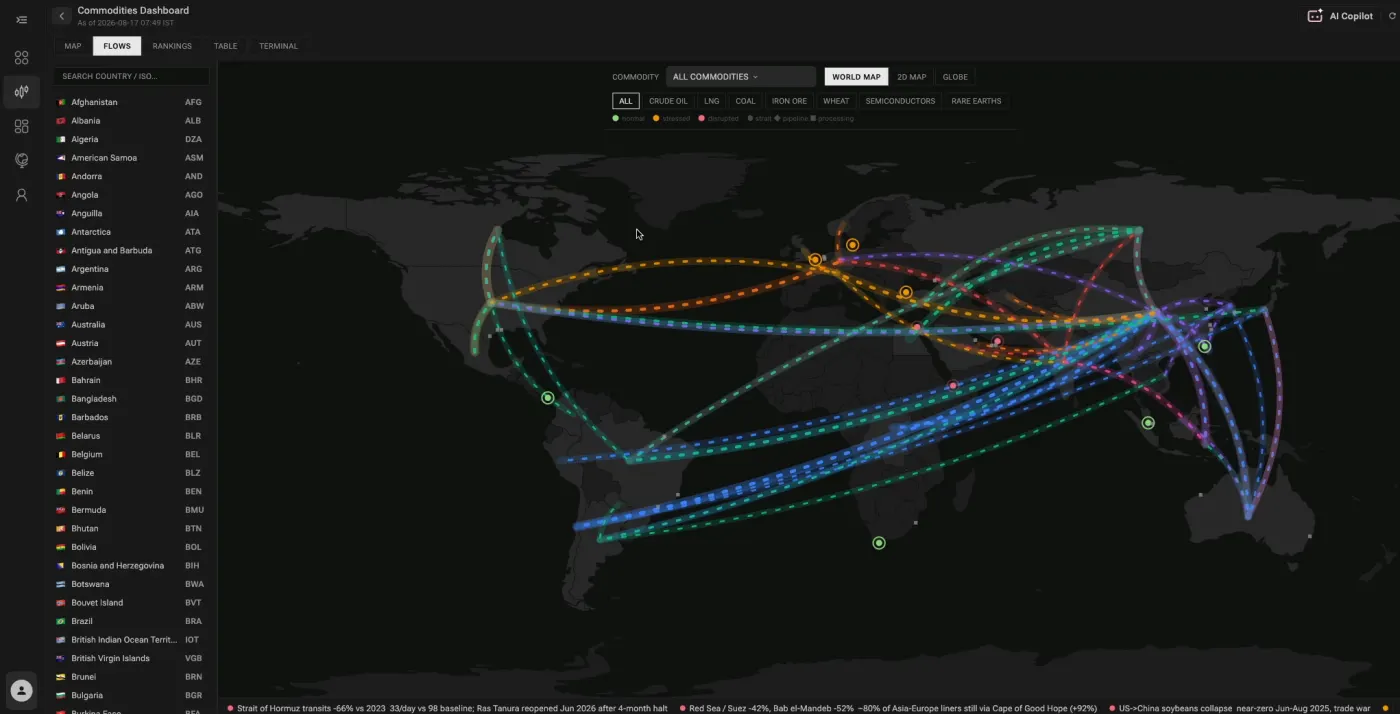
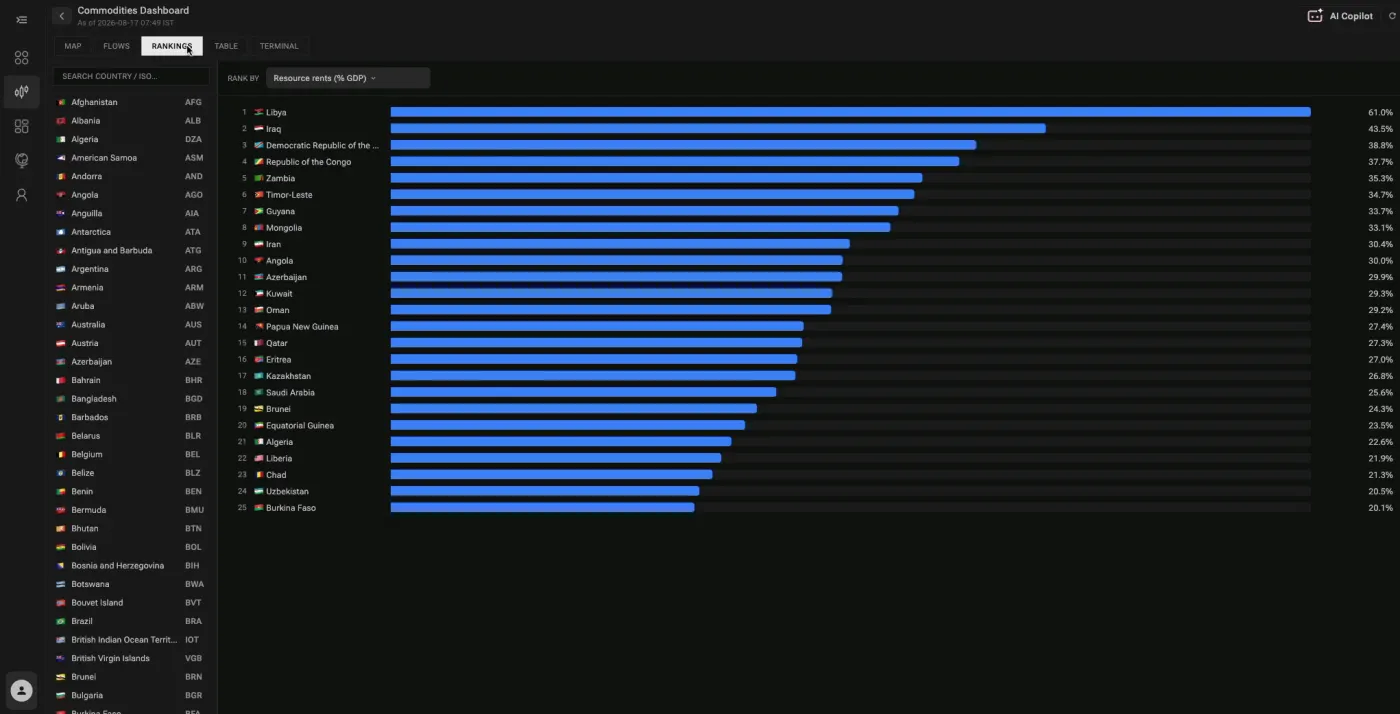
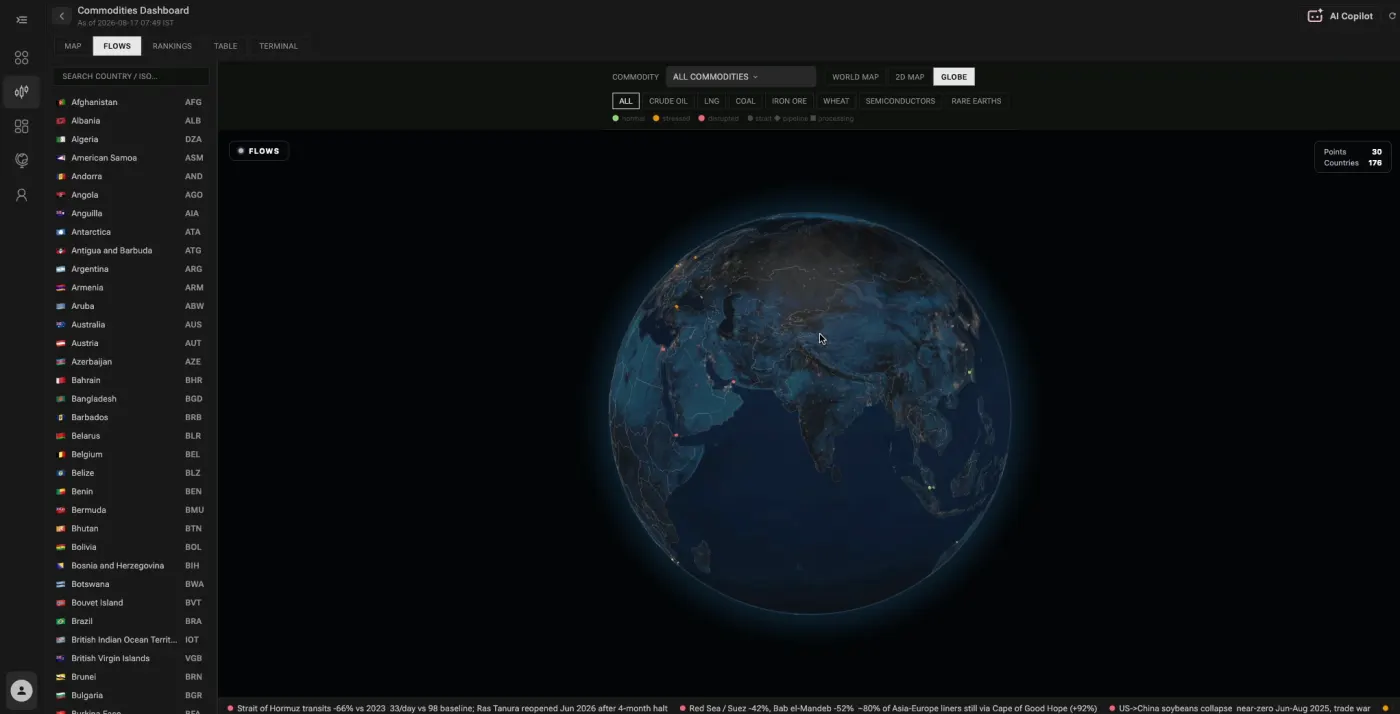
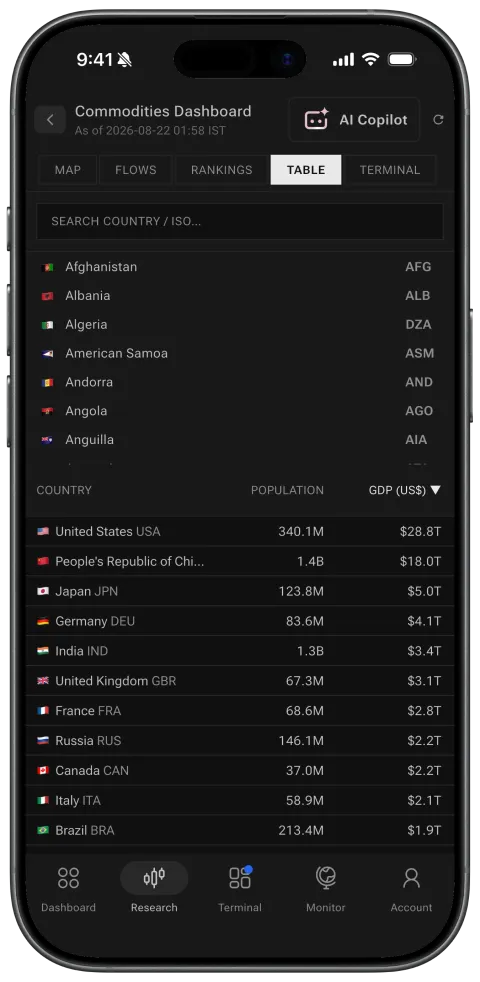
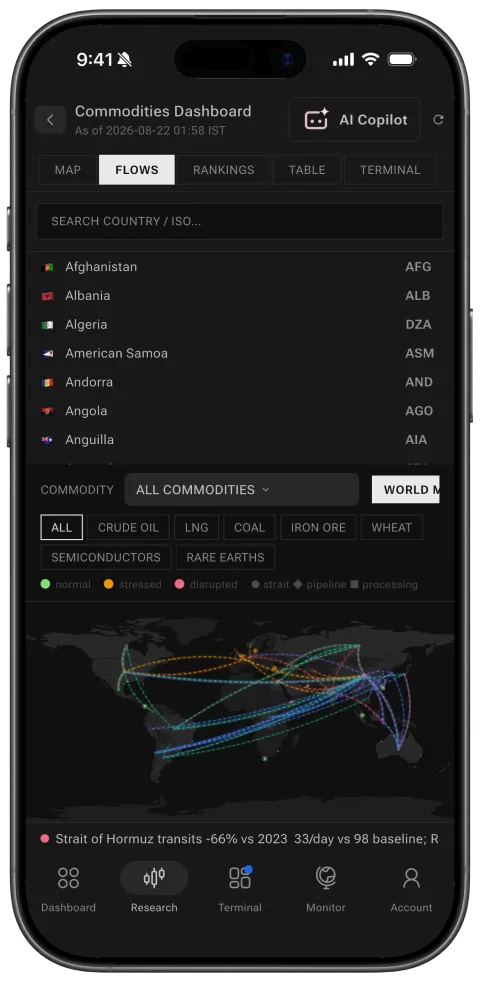
Flows: Trade routes between countries.Rankings: Countries ranked on any measure.Table: The whole world in one table.Map: One colour scale, any measure.Globe: The same, on a globe.

Commodities

The physical economy, end to end.
Commodities: Trade flows
01Trade flowsWhere energy, metals and food move, on one map.
Commodities: Chokepoints
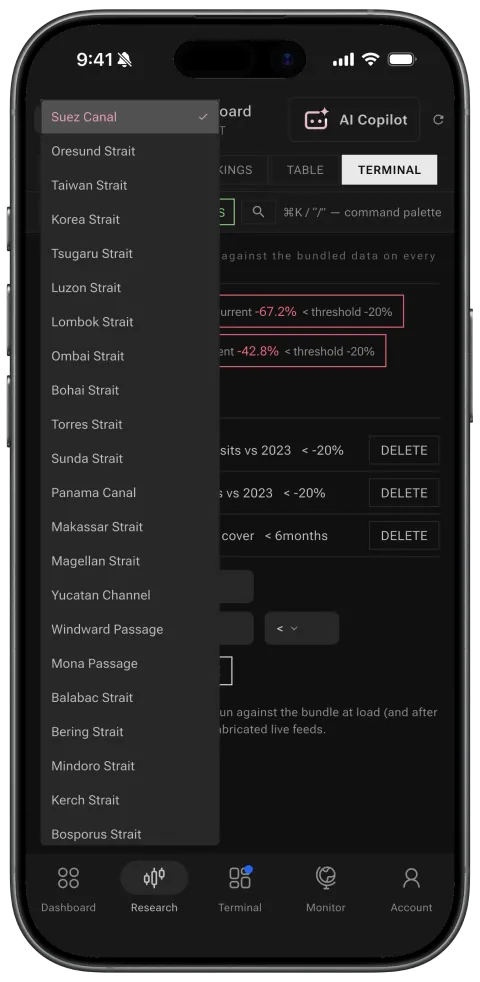
02ChokepointsTransits through the straits and canals the world depends on.
Commodities: Country profiles
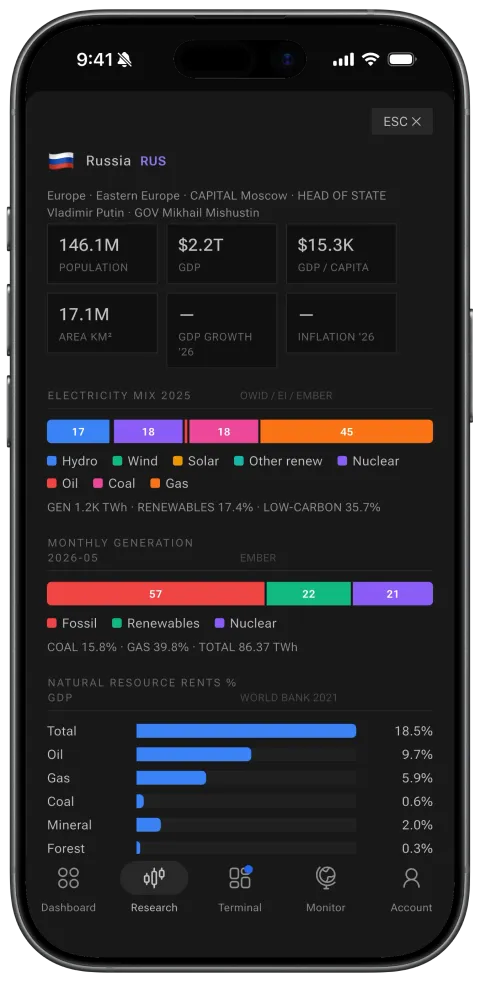
03Country profilesPopulation, output and energy mix for any country.
Commodities: Rankings
04RankingsCountries ranked on the resource you pick.
Commodities: Morning brief
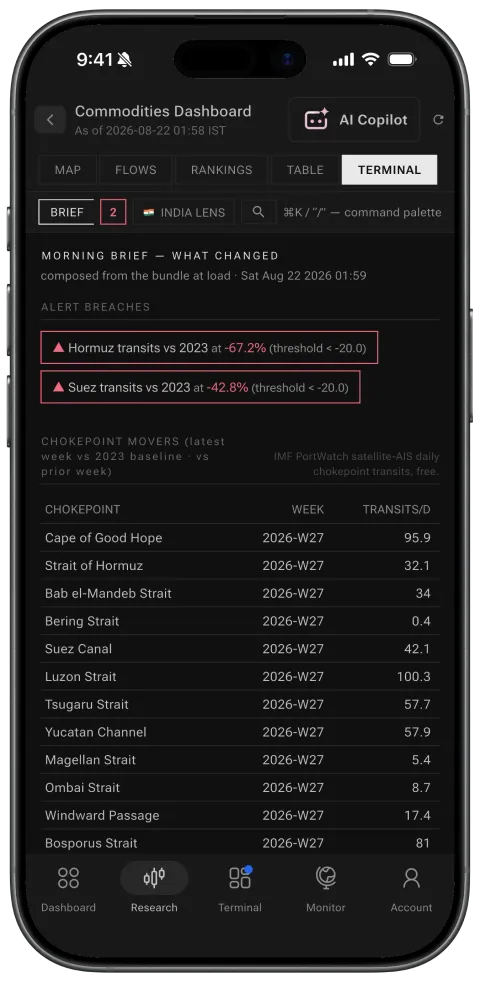
05Morning briefWhat changed overnight, flagged against its own threshold.
Commodities: Energy
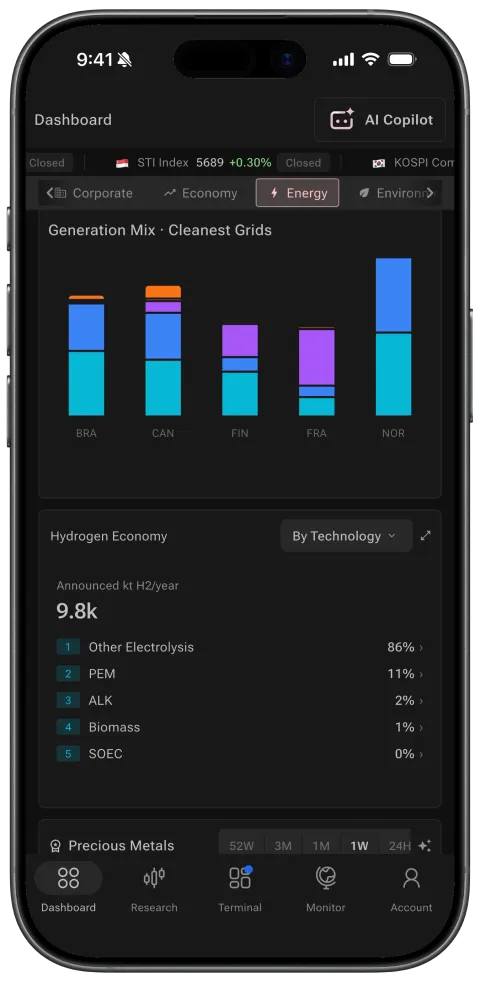
06EnergyGeneration mix and the cleanest grids.

You can click through all of it. Or just ask.

The AI Copilot is on the page, holding every route, every chokepoint and sixty years of prices while you type. One question, and fourteen screens answer at once.

Every route
Every chokepoint
60 years of prices
boltAI Copilot
personYour answer

Risk Disclaimer

Trading in stocks, derivatives, and cryptocurrencies involves substantial risk of loss and is not suitable for all investors. Past performance is not indicative of future results. FlashTerminal is a technology platform and does not provide investment advice or recommendations. Please consult with a licensed financial advisor before making any investment decisions.